


We’re once again at the end of our internship season, and it’s my task to provide a few highlights of what the dev interns accomplished while they were here.
The program was big! We had 152 software engineering interns, drawn from 58 schools across 19 different countries. And that’s not even counting the 31 tech interns in areas like production engineering, IT engineering, network engineering, and more.
The intern program is so big and diverse that it’s impossible to faithfully summarize it with just a few projects. But, something is better than nothing, so here are the projects I’ll discuss this time around:
-
Rajeev Godse wrote a query language based on Linear Temporal Logic for querying complex events out of system logs.
-
Semyon Savkin worked on our AI Assistants team, building an efficient tokenizer in OCaml.
-
Sasha Hydrie added concurrency support to our tracing syntax, making it suitable for use with our asynchronous programming frameworks.
Now let’s dive into the details!
A temporal query language
Concord (which we’ve talked about before) is a platform for building systems that let counterparties connect to us to trade directly with or through us.
Concord’s architecture is built around a single, totally-ordered stream of transactions. One nice thing about this approach is that the transaction stream is a great debugging aid: an incredibly detailed source-of-truth that you can dive into when you’re trying to figure out why the system is misbehaving.
Unfortunately, the tooling we had for digging into this treasure trove was a bit limited. All we really had was the ability to find and grab individual messages. But sometimes you want more than that! You want to search for sequences of events that match some specified criteria.
We did have some tooling for this. In particular, one of our
engineers had built a stream query system based on linear temporal
logic, or, LTL
for short. LTL is a well-studied logic that takes basic propositional
logic and adds to it two key operators: next and until.
Roughly, p next q means that predicate p holds currently, and that
predicate q holds thereafter. And p until q means that p holds
currently, and will continue to hold until q starts holding.
If it’s not obvious to you how to use these two operators to build meaningful queries, well, join the club. It can be a bit of a puzzle to figure out how to convert meaningful queries into the fairly low-level logical statements that LTL is built on. To make matters worse, the only syntax we had for writing these queries was a fairly awkward s-expression based format. As a result, almost no one used the LTL query engine.
That’s where Rajeev’s project came in. Rajeev’s goal was to build an easier-to-use, SQL-like query language to act as a frontend to the LTL query engine. The language wouldn’t be quite as expressive as LTL, but it would be a lot easier to use.
We don’t really have space to go into detail on how the language works, but here’s an example of a query for retrieving and printing out retail orders paired with the first execution received by each order:
FIND wholesaling.retail_order.new Retail_order
THEN FIRST wholesaling.route.fill.external Fill
  WHERE .retail_order_id = Retail_order.retail_order_id;
PRINT
, Fill.time - Retail_order.time AS order_to_fill_time
, Retail_order.retail_order_id AS retail_order_id
, Retail_order.time AS arrival_time
;
He built the parser for this new language on top of Angstrom, a parser-combinator library for OCaml. It wasn’t too hard to get a working parser; the biggest challenge was getting good error messages. But after some careful wrestling with the system, Rajeev was able to get it to track enough context to generate good error messages in the cases that mattered.
In addition to getting the basic system in place, Rajeev had time to add a few interesting temporal operators to the language, including:
-
LAST p BEFORE q, which matches messagesM1andM2such thatM2satisfiesqandM1is the last message satisfyingpbeforeM2. -
NO MESSAGE p BEFORE q, which matchesMsatisfyingqsuch that no messages beforeMsatisfyp.
All in, the project was a real success. The new temporal query language has become the go-to tool on the team for debugging performance problems, and there have been requests from other teams to generalize the language so it can be used against other systems as well. This feels like an exciting new part of our toolkit for supporting production systems.
Efficient token-counting in OCaml
If you’ve ever used an AI chatbot you’ll appreciate the importance of keeping track of your token usage—both as a way to keep costs in order and to mind rate limits. Surfacing these token counts in real time to users helps them understand and moderate their own usage.
The project we needed tokenization for is our own web front-end to the various AI chatbots out there. We started off using OpenAI’s tokenization library, tiktoken, which we set up by starting a Python server that we could hit over HTTP.
But, this was a bit of a grungy setup, and we only had access to the token counter from the server, not the client. A pure OCaml implementation would solve both problems at once, since our client is an OCaml program too.
Semyon Savkin’s intern project was to write such an implementation. Token counting is not trivial—it’s not like you just split your input string on spaces—and an early challenge was finding an OCaml regex library that supported all the features used by the regex in tiktoken. Nothing that we found was suitable, especially given the constraint that it had to work in the browser. Fortunately, the regex was simple enough that it was not too difficult for Semyon to handcraft the code for the automaton.
The goal at first was to check that the program’s behavior conformed 100% with the reference implementation, so Semyon wrote a stress test program to spot any differences. But it soon became clear that this was too strict of a requirement, since even a slight difference in the unicode version can cause (very rare) tokenization differences. So Semyon needed to find a way to relax the tests enough to allow for small deviations, without losing too much bug-finding power.
Our initial implementation used a very functional style, with lists and maps. The code was nice and simple, but just not fast enough. So, Semyon spent some time profiling and experimenting, and ended up with a more imperative implementation leveraging hash-tables and arrays, which, along with algorithmic improvements, made a big difference.
By the end of the internship, Semyon had produced two fully functioning tokenizers. We compared the results against both the Python server and also the reference implementations as accessed through the Python API, which were written in Rust. When measured in bytes per microsecond, we blew the Python server out of the water for short messages, due to network latency. But even doing an apples-to-apples comparison with the Rust implementations, we found that our implementation was marginally faster on average for OpenAI tokenization, and a bit less than twice as fast on average for Anthropic tokenization:
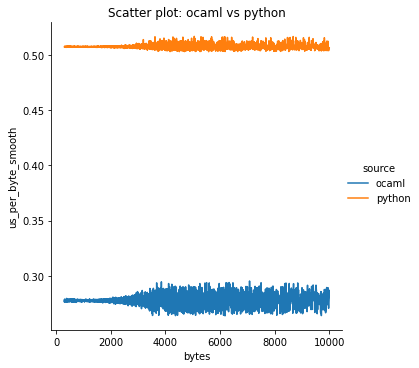
One thing to note about the above graph is that, despite being faster, our variance was worse, which is probably due to GC pauses. This could probably be brought down by being more careful about allocation, but the variance just wasn’t a problem for this application.
We didn’t really expect to beat the performance of OpenAI’s implementation, so that was a pleasant surprise!
Async tracing
ppx_tracing is an OCaml syntax extension that provides
high-performance introspection capabilities for OCaml programs. To use
it, all you have to do is add a small @trace annotation to an
existing function:
let[@trace "demo" "compute" ~n:(n : int)] compute n = (* ... *)
Then, you just have to call Tracing_probes.start somewhere in your
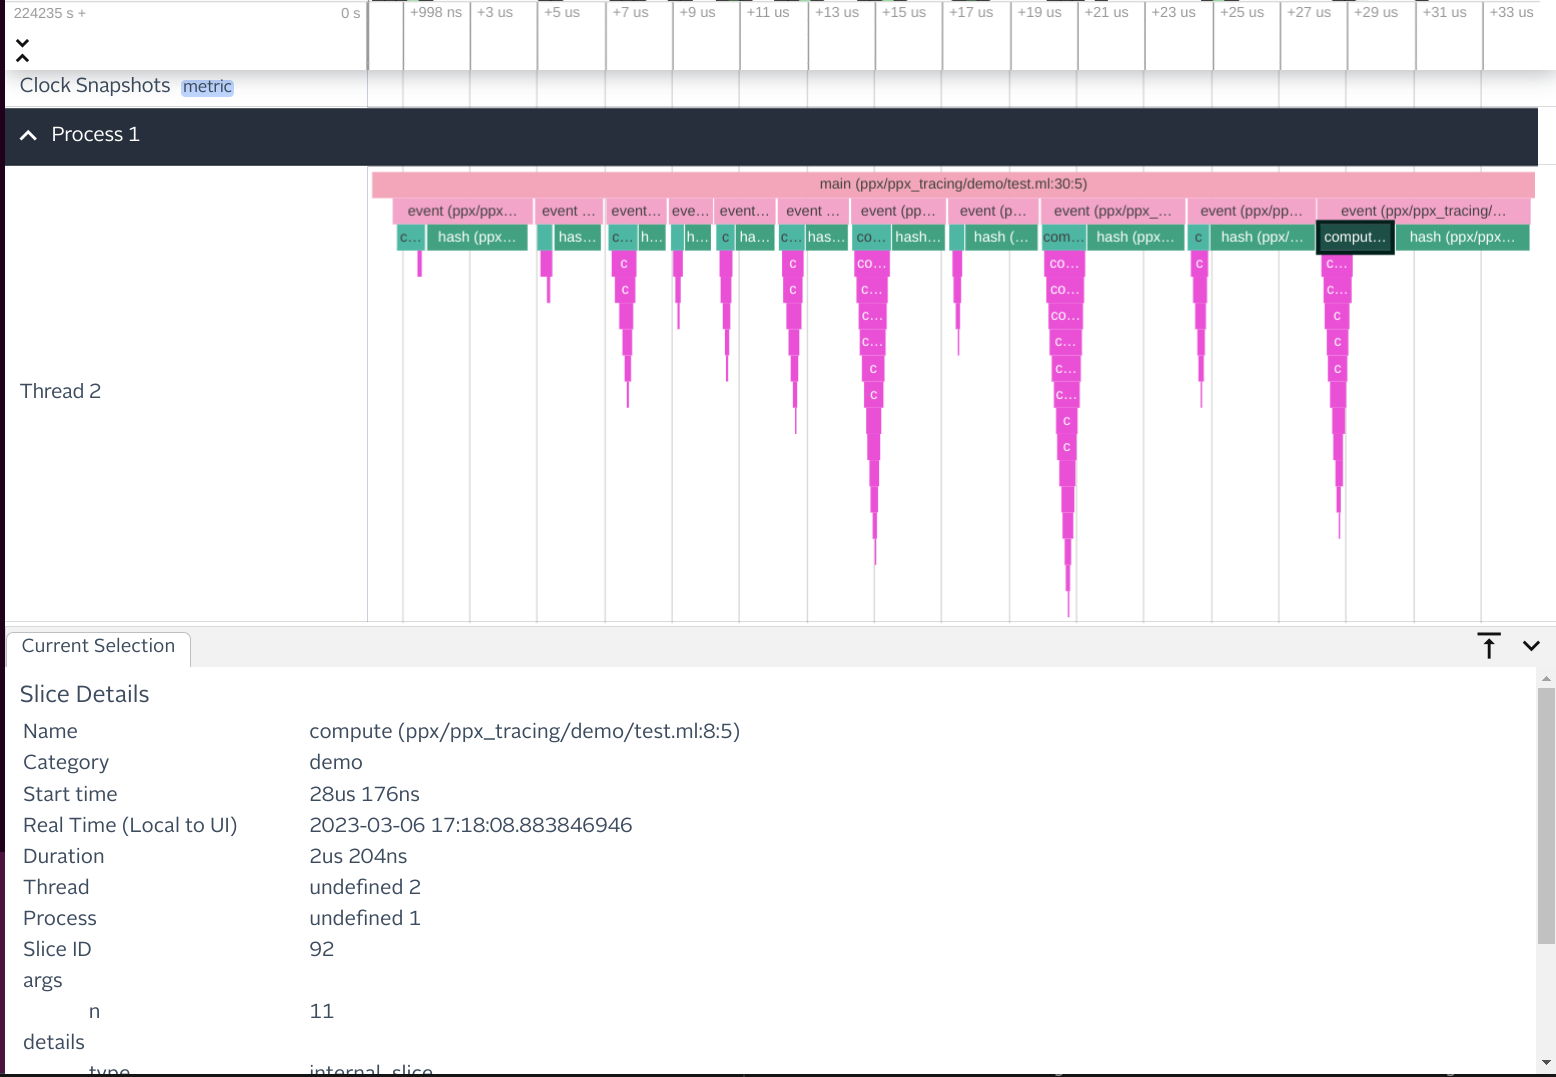
executable, and at runtime you’ll get a UI for viewing traces, built
on top of Perfetto:
When we released ppx_tracing internally, there was one main issue that kept people from really wanting to use it: it didn’t work with asynchronous code. In particular, it couldn’t represent suspending execution in one function and resuming in another.
This was a significant limitation, since most real-world programs do
something asynchronous, say writing to a file or fetching data over
the network. These operations are provided by the Async library,
which lets us wrap asynchronous computations in “deferreds”—the
OCaml equivalent of a Promise in Javascript. Let’s consider the
following Async program for checking disk space usage:
let[@trace "demo" "process"] rec process_directory path =
  let%bind stat = Filesystem_async.stat path in
  [%trace.instant "demo" "stat"];
  let num_bytes = Int63.to_int stat.size |> Option.value ~default:0 in
  match stat.kind with
  | Regular ->
    return num_bytes
  | Directory ->
    let%bind files = Filesystem_async.ls_dir path in
    let%bind entry_sizes =
      Deferred.List.map ~how:(`Max_concurrent_jobs 10) files ~f:(fun file ->
        let res = process_directory (path /?. file) in
        res)
    in
    return (List.fold entry_sizes ~init:0 ~f:( + ))
  | _ -> return 0
;;
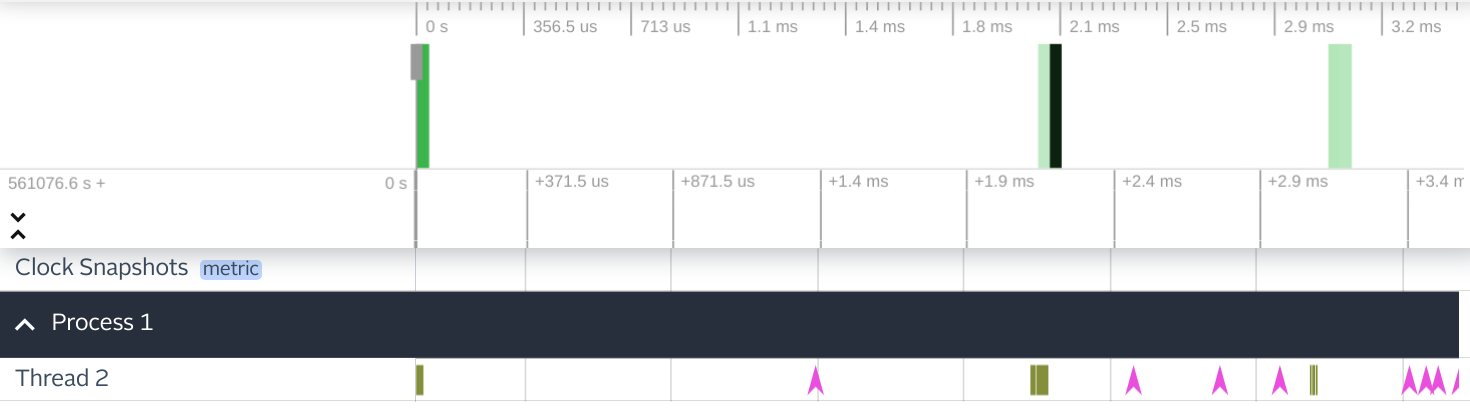
Running the program with tracing enabled produces a confusing
result. Here, spans representing calls to process_directory only
capture the time taken to allocate a new deferred. Further, since the
trace only keeps track of one pending function call, we can’t know
which invocation of process_directory generated each instant event.
The crux of Sasha Hydrie’s intern project was to figure out how to integrate with the Async scheduler to keep track of multiple concurrent execution contexts. This required associating a unique ID with each async function call.
Luckily, the Async scheduler can store metadata along with each
deferred computation. When switching to a new task, the scheduler
makes its data (known as the “execution context”) globally accessible.
Therefore, upon entering an async function, we can store a unique
“correlation ID” in the context. This gives us the ability to
distinguish between multiple invocations of process_directory.
Later on, when the task actually executes, we can query the current ID
to see which function we’re in.
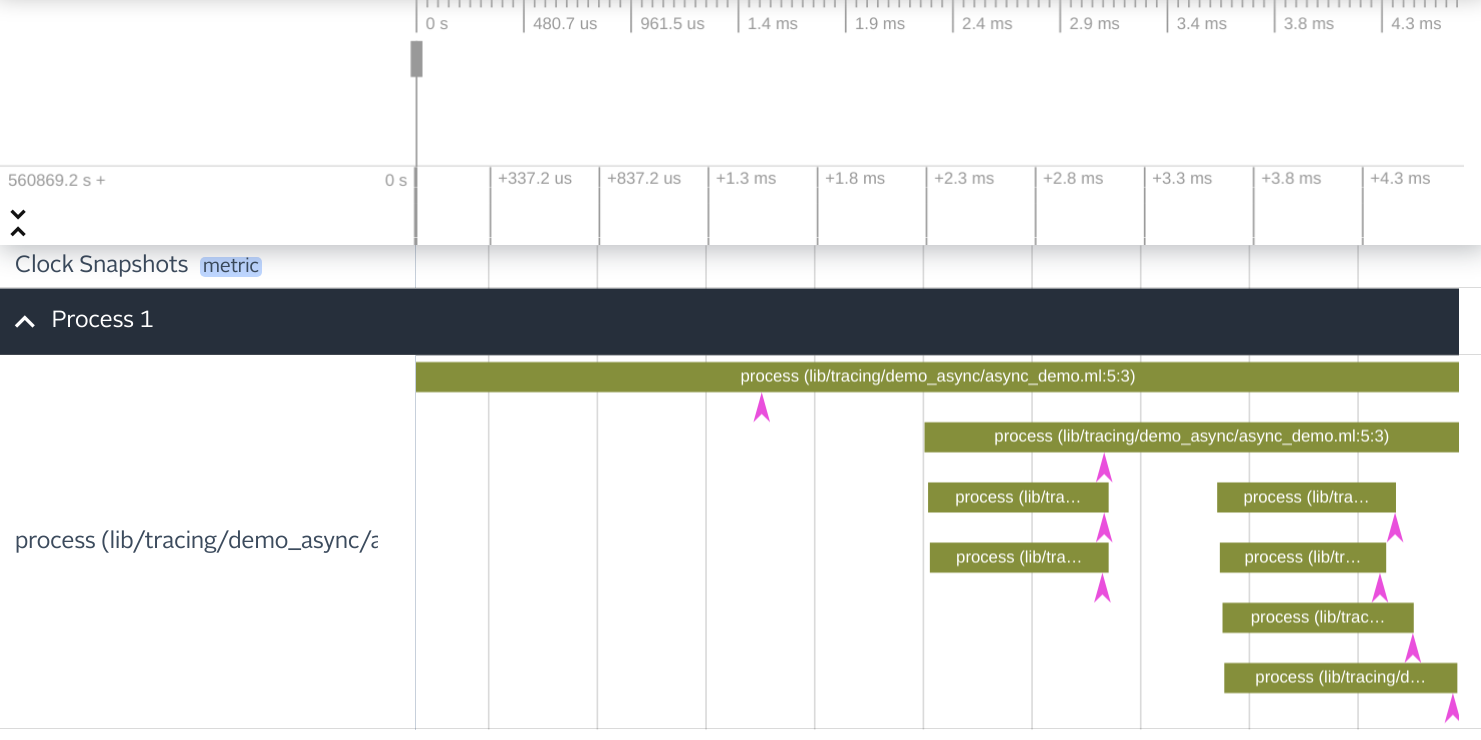
Sasha extended the PPX with a new annotation (@trace.async)
implementing this behavior. The resulting IDs must end up in the
final trace file, so he also updated our Fuchsia trace format tooling
to support the relevant event types. Now, updating our example with
@trace.async gives a much more sensible result—we can see how long
each call is actually in flight, and how many are executing in
parallel. Further, instant events are able to query the active
correlation ID to determine which call they are a part of.
However, not all functions are asynchronous. We don’t want every synchronous function to create a new track, but we also don’t want to mix them all together. Therefore, Sasha added a new async mode to the PPX, where synchronous function calls will also query the current correlation ID and dynamically attach to a parent async call.
Already Sasha’s work has enabled wider adoption of ppx_tracing; the tool should now work in most real-world programs. The team behind Iron, our in-house code review system, used it to improve their server’s startup time by about 50%, within days of the final project being released.
Given the success of the project, there is, of course, more work yet to do: we’re hoping to integrate ppx_tracing with a new distributed tracing system we’ve built, as well as perform more detailed tracing of the Async scheduler itself.
So, what are you waiting for?
Summarizing the whole summer in just a handful of projects is an impossible task, but I hope this gives you a flavor of the kinds of things that our interns do.
If this sounds like fun, then you should apply. The internship is a great chance to learn, both about software engineering, and about the world of trading. And if you’d like to know more about our interview process, take a look here.